Understanding Tens and Ones: The Building Blocks of Place Value
Place value is the cornerstone of our decimal number system. It tells us that the position of a digit determines its value. The first two positions—tens and ones—are the most accessible for young learners and form the foundation for all later math concepts. This article explains what tens and ones are, how a tens and ones chart works, and provides practical ideas for teachers, parents, and students.
What Are Tens and Ones?
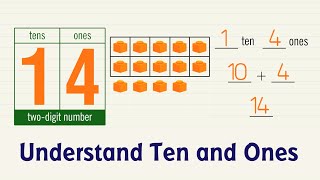
In a base‑10 system each place represents a power of ten. The right‑most digit is the ones place, representing single units (1, 2, 3, …). The next digit to the left is the tens place, representing groups of ten (10, 20, 30, …). For example, the number 46 contains four tens (40) and six ones (6). Understanding this split helps children see why 46 is larger than 45 and how numbers can be broken apart for easier addition or subtraction.
How a Tens and Ones Chart Works
A tens and ones chart is a simple visual grid with two columns:
- Tens column – each square stands for a group of ten.
- Ones column – each square stands for a single unit.
To represent a number, you fill the appropriate number of squares in each column. For 27, you would shade two squares in the tens column (20) and seven squares in the ones column (7). The chart makes the abstract idea of “place value” concrete, allowing learners to count, add, and subtract with confidence.
Benefits of Using a Tens and Ones Chart
- Concrete visual learning – Children can see groups of ten and individual ones side by side.
- Improved number sense – Regular use helps students quickly recognize how numbers are composed.
- Supports mental math – Breaking numbers into tens and ones speeds up addition, subtraction, and estimation.
- Easy integration – The chart works with worksheets, games, and digital apps.
Step‑by‑Step Guide to Using the Chart
- Identify the target number. Write it on the board or a worksheet.
- Count the tens. Divide the number by ten and place the resulting whole number in the tens column.
- Count the ones. Subtract the value of the tens (tens × 10) from the original number; the remainder goes in the ones column.
- Shade the squares. Fill the appropriate number of squares in each column to create a visual representation.
- Check the work. Add the values of the shaded tens and ones to confirm they equal the original number.
Example: Representing 58
• Tens: 58 ÷ 10 = 5 tens → shade five squares in the tens column (5 × 10 = 50).
• Ones: 58 – 50 = 8 ones → shade eight squares in the ones column.
The chart now shows 5 groups of ten and 8 single units, clearly illustrating the composition of 58.
Creating Your Own Tens and Ones Chart
Teachers and parents can make a reusable chart with simple materials:
- Large poster board or whiteboard.
- Two labeled columns: “Tens” and “Ones”.
- Sticky notes, magnetic squares, or colored markers for shading.
Because the chart is reusable, students can practice with many numbers in a single session, reinforcing the concept through repetition.
Integrating the Chart with Classroom Activities
Here are three classroom‑friendly activities that incorporate the tens and ones chart:
- Number Build‑Up – Call out a number; students race to fill the chart correctly.
- Partner Swap – One student creates a chart for a number, the partner reads the chart and writes the corresponding numeral.
- Chart Challenge – Provide a set of numbers; students must arrange them from smallest to largest using only the charts.
Digital Resources and Fun Extensions
Many online tools reinforce the same concepts:
- The Place Value Song by Jack Hartmann – A catchy video that sings about tens, ones, hundreds, and beyond. It’s an excellent follow‑up after using a chart.
- Kids Academy – A learning app that offers interactive place‑value games, worksheets, and quizzes aligned with the chart method.
- Mage Math – A full video game (https://www.MageMath.com/) where players solve place‑value puzzles to advance. The game includes levels focused specifically on tens and ones.
These resources keep practice engaging and allow students to apply the chart in a virtual environment.
Why Tens and Ones Matter Beyond the Classroom
Understanding tens and ones supports everyday tasks such as:
- Counting money (e.g., recognizing that a dime equals one ten‑cent group).
- Measuring length with a ruler marked in centimeters and millimeters.
- Reading calendars, where days are grouped into weeks (seven‑day “tens‑like” groups).
When children see the relevance of tens and ones in real life, their motivation to master place value increases.
Tips for Parents at Home
- Use household objects (coins, blocks, snack items) to build physical tens and ones groups.
- Play “store” where the child gives change using tens and ones.
- Incorporate short daily drills: ask, “What is 3 tens and 4 ones?” and have the child write the numeral (34).
Conclusion
The tens and ones chart is a versatile, low‑cost tool that transforms abstract numbers into tangible groups. By regularly using the chart, students develop a solid grasp of place value, improve mental math, and gain confidence in everyday numerical tasks. Pair the chart with songs, apps like Kids Academy, and games such as Mage Math for a well‑rounded learning experience. Whether in a classroom, at home, or on a digital platform, mastering tens and ones sets the stage for success in all future math learning.