Understanding the SWBST Anchor Chart for Reading Comprehension
For educators and students, mastering the art of summarizing a story can be a significant challenge. One of the most effective tools used in modern classrooms to simplify this process is the SWBST Anchor Chart. This instructional visual serves as a roadmap for students to identify the core elements of a narrative without getting bogged down in unnecessary details.
What Is an SWBST Anchor Chart?
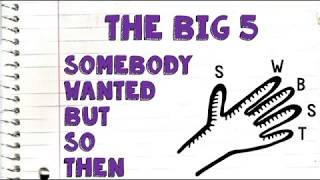
SWBST is an acronym that stands for Somebody, Wanted, But, So, Then. An anchor chart is a large, visible poster created in the classroom that "anchors" the learning by providing a constant reference point for students. When combined, the SWBST Anchor Chart provides a structured framework that helps readers distill a plot into a concise summary.
By following this five-step formula, students can move beyond simply retelling a story and instead begin to analyze the causal relationships between a character's desires and the eventual resolution of the plot.
Breaking Down the SWBST Framework
To create an effective summary, students are taught to answer five specific prompts. Each part of the acronym corresponds to a critical element of storytelling:
- Somebody: Who is the main character? This identifies the protagonist of the story.
- Wanted: What was the character's goal? This establishes the motivation and the primary objective.
- But: What was the problem? This introduces the conflict or the obstacle that stands in the character's way.
- So: How did the character try to solve the problem? This describes the action taken to overcome the conflict.
- Then: What happened in the end? This provides the resolution or the final outcome of the story.
How to Create a Beautiful and Effective Anchor Chart
Have you ever wondered how to create beautiful and functional anchor charts that actually engage students? The key is to balance visual appeal with clarity. A cluttered chart can overwhelm a learner, while a too-simple chart may lack necessary guidance.
When designing your SWBST chart, consider the following tips:
- Use Color Coding: Assign a different color to each part of the acronym. For example, make "Somebody" blue and "But" red. This helps students visually categorize the different parts of the plot.
- Include Visual Cues: Add small icons next to each word. A silhouette of a person for "Somebody" or a stop sign for "But" can help younger learners or English Language Learners (ELL) grasp the concept more quickly.
- Provide a Concrete Example: Don't just list the definitions. Include a real-world example from a popular book the class has read. For instance, if reading The Three Little Pigs, the chart might show: Somebody (The Pigs) Wanted (to build houses), But (the wolf blew them down), So (they built a house of bricks), Then (the wolf couldn't get in and they were safe).
- Leave White Space: Ensure there is enough room between the sections so the eye can easily navigate the flow of the summary.
The Connection Between SWBST and the Plot Diagram
The SWBST method is essentially a simplified version of a traditional plot diagram. While a plot mountain diagram focuses on the exposition, rising action, climax, falling action, and resolution, the SWBST chart focuses on the narrative drive.
Integrating both tools can increase a student's storytelling power. While the plot diagram helps them visualize the "shape" of the story, the SWBST chart gives them the specific language needed to write a summary. Moving from the visual mountain to the written summary ensures that students understand both the structure and the content of the text.
Why the SWBST Method Works
The primary reason the SWBST Anchor Chart is so successful in literacy instruction is that it removes the "fear of the blank page." Many students struggle to start a summary because they