Understanding the Statistical Question: A Comprehensive Guide
Are you ready to dive into the world of data analysis? Before you can calculate a mean, create a histogram, or identify a trend, you must first understand the foundation of data collection: the statistical question. Whether you are a student in a middle school math class or a professional analyzing market trends, knowing how to frame a question is the first step toward meaningful discovery.
What is a Statistical Question?
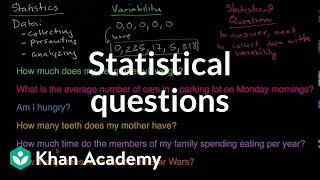
A statistical question is a question that can be answered by collecting data that has variability. In simpler terms, a statistical question is one where you expect to receive a variety of different answers rather than a single, fixed fact.
The key element here is variability. If a question has only one possible correct answer, it is a deterministic or factual question, not a statistical one. For a question to be statistical, the data collected must vary across the group or items being studied.
Statistical vs. Non-Statistical Questions
To truly understand this concept, it is helpful to compare examples of statistical questions with those that are non-statistical.
Example 1: The Height of Students
- Non-Statistical: "How tall is the tallest student in the classroom?" (This results in one specific number. There is no variability in the answer.)
- Statistical: "How tall are the students in the classroom?" (This requires measuring every student, and you will receive a variety of results.)
Example 2: Pet Ownership
- Non-Statistical: "Does Sarah have a dog?" (The answer is a simple "yes" or "no.")
- Statistical: "How many pets do the students in Sarah's grade own?" (Different students will have different numbers of pets, providing a data set to analyze.)
When analyzing these, remember: if you are not going to receive a variety of results, it means this is a non-statistical question.
Why Variability Matters
Variability is the heartbeat of statistics. If every person in a study gave the exact same answer, there would be no need for statistical tools. We use statistics to describe the spread and center of data. By asking statistical questions, researchers can determine:
- The Average (Mean): The central tendency of the data.
- The Range: The difference between the highest and lowest values.
- The Distribution: How the data is spread out across different categories or values.
Experts like Jeffrey Rosenthal, a professor of statistics, emphasize that the way a question is framed directly impacts the quality of the data collected. A poorly framed question can lead to biased data or a lack of usable variability.
How to Create Your Own Statistical Question
If you are designing a survey or a math project, follow these three steps to ensure your question is statistical:
- Identify your population: Decide who or what you are studying (e.g., "all 7th graders," "all cars in the parking lot").
- Identify the variable: Decide what you are measuring (e.g., "height," "color," "price").
- Check for variability: Ask yourself, "Will I get different answers from different members of the population?" If the answer is yes, you have a statistical question.
Resources for Further Practice
Mastering the difference between statistical and non-statistical questions requires hands-on practice. If you want to sharpen your skills, there are several excellent resources available online.
Practice this lesson yourself on KhanAcademy.org right now. Courses on Khan Academy are always 100% free. Start practicing—and saving your progress—now to ensure you have a firm grasp of data variability.
For those who prefer visual learning, there are many instructional guides