Math Division Table Chart: A Complete Guide for Learners and Teachers
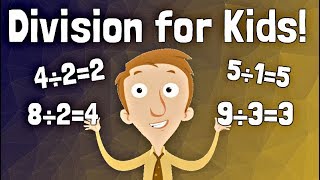
Division is one of the core operations in elementary mathematics, yet many students find it harder to master than addition or multiplication. A math division table chart offers a clear, visual way to see division facts at a glance, making practice faster and more engaging. In this article we explain what a division table chart is, how it connects to multiplication, how to create and use one effectively, and where you can find free resources such as the popular “Division Table | 1 to 10” short video on YouTube.
What Is a Math Division Table Chart?
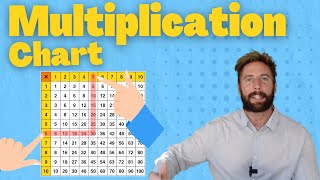
A division table chart is a grid that lists dividends (the numbers being divided) on one axis and divisors (the numbers you divide by) on the other. Each cell shows the quotient – the result of the division. For example, the cell where the row 12 meets the column 3 contains the number 4, because 12 ÷ 3 = 4.
Most charts cover the range 1 to 10 or 1 to 12, which aligns with the standard multiplication tables taught in early grades. This overlap is intentional: division is the inverse of multiplication, so the same set of facts can be used in both directions.
Why Use a Division Table Chart?
- Quick Reference: Students can locate a fact in seconds without having to calculate each time.
- Memory Reinforcement: Repeated exposure helps commit division facts to long‑term memory.
- Fluency Building: Knowing the table speeds up more complex problems, such as multi‑digit division or word problems.
- Confidence Boost: Seeing the whole set of answers reduces anxiety and encourages independent practice.
How to Use a Division Table Chart Effectively
- Identify the dividend. Find the number you want to divide on the left‑hand column (or top row, depending on the chart layout).
- Identify the divisor. Locate the number you are dividing by on the top row (or left column).
- Read the quotient. The intersecting cell gives the answer. If the cell is blank, the division does not result in a whole number within the chart’s range.
- Check with multiplication. Multiply the quotient by the divisor to verify the original dividend. This step reinforces the relationship between the two operations.
For instance, to solve 18 ÷ 6, find 18 on the dividend side and 6 on the divisor side. The chart shows 3. Multiply 3 × 6 = 18 to confirm the answer.
Connecting Multiplication and Division
Many teachers ask, “How can you use a multiplication fact to solve a division problem?” The answer lies in the inverse nature of the two operations. If you know that 7 × 8 = 56, you automatically know that 56 ÷ 7 = 8 and 56 ÷ 8 = 7. Using a division table chart alongside a multiplication table helps students see this two‑way connection, turning one set of facts into a powerful learning shortcut.
Creating Your Own Division Table Chart
If you prefer a customized chart, several tools make the process simple:
- Spreadsheets: Microsoft Excel or Google Sheets let you generate a table with formulas (e.g., =A2/B$1) and format it for printing.
- Math Software: Programs like GeoGebra or Desmos can produce interactive charts that students manipulate on a screen.
- Online Generators: Websites such as mathantics.com offer free printable division tables and related videos.
When designing your chart, consider the following tips:
- Include both the 1‑to‑10 range and a “remainder” column for non‑exact divisions.
- Use bold headings for the dividend and divisor axes to improve readability.
- Print on durable paper or laminate for classroom use.
Division Table | 1 to 10 – A Short Video Resource
Short, engaging videos are an excellent supplement to a printed chart. The “Division Table | 1 to 10” short video (often tagged #maths #division #shorts #shortvideo) walks learners through each fact in under two minutes. Watching the video before using the chart helps students internalize the sequence of answers, making the chart feel familiar when they reference it later.
Practical Activities Using a Division Table Chart
- Flash Card Challenge: Write division problems on one side of a card and the answer on the back. Use the chart to check answers quickly.
- Real‑World Scenarios: Ask students to divide a set of objects (e.g., 24 crayons) among a group of friends. They locate the answer on the chart and then verify by grouping the objects.
- Speed Drills: Set a timer for one minute and see how many correct quotients a student can find using the chart.
- Reverse‑Check Games: Give the quotient and divisor, and have students find the missing dividend using multiplication, then confirm with the chart.
Tips for Improving Division Skills
Are you looking to improve your division fluency? Try these proven strategies:
- Start with the basics: Master division by 1, 2, 5, and 10 first; these have predictable patterns.
- Use the chart daily: A few minutes of quick reference each day builds automatic recall.
- Combine visual and auditory learning: Pair the chart with short videos from mathantics.com or similar channels.
- Teach the “why”: Explain why 9 ÷ 3 = 3 by showing the multiplication 3 × 3 = 9.
- Practice with real objects: Manipulatives such as counters or fraction strips make abstract numbers concrete.
Frequently Asked Questions
Q: Do I need a separate chart for each divisor?
A: No. A single 1‑to‑10 chart includes all divisors in the same grid, allowing you to locate any fact quickly.
Q: How can I help a student who struggles with remainders?
A: Add a “remainder” column to the chart. For example, 7 ÷ 3 = 2 R1. This visual cue clarifies that the division is not exact.
Q: Is a digital chart better than a printed one?
A: Both have advantages. Digital charts can be interactive and portable, while printed charts are tactile and can be used without a device.
Conclusion
A well‑designed math division table chart is more than a reference sheet; it is a learning scaffold that connects multiplication, reinforces memory, and builds confidence. By integrating the chart with short instructional videos, hands‑on activities, and regular practice, students can move from hesitant calculators to fluent problem solvers. Whether you download a ready‑made chart from mathantics.com or create a custom version in a spreadsheet, the key is consistent use and connection to real‑world examples.
Additional Resources
- Visit mathantics.com for free division videos, printable charts, and interactive games.
- Search YouTube for “Division Table | 1 to 10 #maths #division #shorts” to find short, shareable clips.
- Explore printable worksheets on educational sites such as TeachersPayTeachers or Education.com for extra practice.
Start using a division table chart today, and watch your division skills—and confidence—grow.