Understanding the Decimal Value Chart
The Decimal Value Chart is a visual tool that helps students see the relationship between each digit in a decimal number and its corresponding place value. By aligning numbers under headings such as ones, tenths, hundredths, and thousandths, the chart makes it easier for learners to compare, add, and subtract decimals with confidence.
Why a Decimal Value Chart Matters in Elementary Math
For 4th and 5th grade teachers, mastering decimal concepts is a key milestone. A well‑designed chart provides a concrete reference that supports:
- Clear identification of each digit’s value.
- Accurate placement of numbers during operations.
- Confidence when moving between whole numbers and fractions.
Research shows that visual representations improve retention, especially when students can interact with the material. A Decimal Value Chart offers that interactive element without needing complex technology.
Components of a Standard Decimal Value Chart
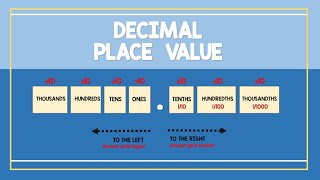
A typical chart includes the following headings, extending from left to right:
- Thousands
- Hundreds
- Tens
- Ones
- Decimal Point
- Tenths
- Hundredths
- Thousandths
Each column represents a power of ten, either positive (to the left of the decimal point) or negative (to the right). By placing a number under the appropriate headings, students instantly see the magnitude of each digit.
How to Read a Decimal Value Chart
Reading the chart involves two simple steps:
- Locate the decimal point. This separates whole‑number values from fractional values.
- Identify each digit’s column. Multiply the digit by the value of its column (e.g., a 5 in the hundredths column equals 5 × 0.01 = 0.05).
Example: The number 3.274 is entered as follows:
- 3 under Ones → 3 × 1 = 3
- 2 under Tenths → 2 × 0.1 = 0.2
- 7 under Hundredths → 7 × 0.01 = 0.07
- 4 under Thousandths → 4 × 0.001 = 0.004
Adding the values gives the original number: 3