Understanding Decimal Place Value Anchor Charts
A decimal place value anchor chart is a visual reference tool designed to help students grasp how decimal numbers are structured and read. These charts break down each position to the right of the decimal point, showing how every digit holds a specific value based on its location. For educators and learners alike, having a clear, printed, or displayed chart can transform abstract decimal concepts into something tangible and easy to revisit.
Anchor charts are especially useful in classroom settings where visual memory supports retention. When students can glance at a chart during lessons or homework, they build confidence faster and make fewer errors when reading, writing, or comparing decimal numbers.
What Is a Decimal Place Value Chart?
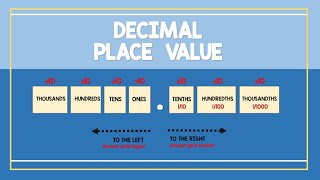
A decimal place value chart is a table that organizes digits according to their position relative to the decimal point. On the left side of the decimal, you find whole number places such as ones, tens, hundreds, thousands, and beyond. On the right side, the chart continues with tenths, hundredths, thousandths, and further denominations. Each column represents a power of ten, decreasing by a factor of ten as you move rightward.
For example, in the number 47.358, the digit 4 sits in the tens place, 7 is in the ones place, 3 occupies the tenths place, 5 is in the hundredths place, and 8 rests in the thousandths place. A well-designed anchor chart makes these relationships immediately visible, which is why many teachers use them throughout the 4th grade to 5th grade range when decimals are first introduced systematically.
Key Components of an Effective Anchor Chart
The best decimal place value anchor charts include several essential elements:
- The decimal point: Clearly labeled as the anchor separating whole numbers from fractional parts.
- Column headers: Each place value named explicitly, from hundreds (or higher) down to thousandths or ten-thousandths depending on grade level.
- Color coding: Using different colors for whole number places and decimal places helps students visually distinguish the two regions.
- Example numbers: Including sample decimals and walking through how each digit maps to a column reinforces understanding.
- Place value names: Writing out "tenths," "hundredths," and "thousandths" alongside their abbreviated forms supports vocabulary development.
When these components come together, the chart becomes more than a poster—it becomes a learning scaffold students can rely on independently.
How Teachers Use Anchor Charts in the Classroom
Teachers often create anchor charts collaboratively with their students at the start of a decimal unit. This process gives learners ownership over the material and encourages deeper engagement. Once completed, the chart is mounted on a bulletin board, taped inside notebooks, or projected digitally during remote lessons.
During instruction, educators reference the chart while modeling how to read decimals aloud, compare two decimal values, or round decimals to a given place. Students who struggle can return to the chart repeatedly until the concept clicks. Some teachers also have learners recreate simplified versions at home for additional practice.
Free Resources to Support Decimal Learning
Several online platforms offer complementary materials for students working with decimal place value. You can visit ramymelhem.com for free online quizzes and videos that reinforce the skills shown on your anchor chart. Mathantics.com provides engaging free math videos and additional subscription-based content that covers decimal topics in detail.
For video-based learners, channels like Pink Pencil Math Tutors feature lessons specifically about decimal place value charts, including how to read, write, and interpret decimals across different place positions. Their videos often appear within curated playlists, so watching them in sequence helps build knowledge progressively. Additionally, platforms like Edpuzzle allow educators to embed questions directly into videos, turning passive viewing into active practice.
Tips for Creating Your Own Anchor Chart
If you prefer making a custom chart rather than using a ready-made one, consider the following steps:
- Start with a large piece of paper or a digital canvas.
- Draw a grid with columns for each place value you want to cover.
- Label every column clearly, including the decimal point.
- Add color highlights to separate the whole number section from the decimal section.
- Incorporate a worked example with a real decimal number filled into the grid.
- Include a quick reminder about how to read a decimal aloud, such as saying "and" at the decimal point.
Personalizing the chart with student-friendly language or decorative elements can increase motivation and make review sessions feel less routine.
Why Visual Aids Matter for Decimals
Decimals represent one of the first major transitions students face from whole number arithmetic to more abstract mathematical thinking. Without a concrete visual aid, it is easy for learners to lose track of what each digit actually represents. An anchor chart provides that necessary bridge, giving students a reliable reference they can turn to during exercises, tests, and real-world applications involving money, measurement, and data.
By combining a strong anchor chart with quality videos, interactive quizzes, and consistent practice, students develop a durable understanding of decimal place value that serves them well in later grades.